
Power BI Template
A Power BI template is provided to simplify the process of connecting to and using the OData API. The template can be downloaded at the bottom of this page.
After November 22, 2022, please download the Power BI Template named GimmalRecordsV2.
This template will automatically connect to primary data as well as the related tables.
Prerequisites
Access to the Gimmal Records cloud service.
The user name and password to a Service Account in the Gimmal Records cloud service.
Gimmal Records Power BI template.
Knowledge of Power BI Desktop.
Opening the Power BI template
Once downloaded, open the template in Power BI Desktop. You will be prompted with the following window:
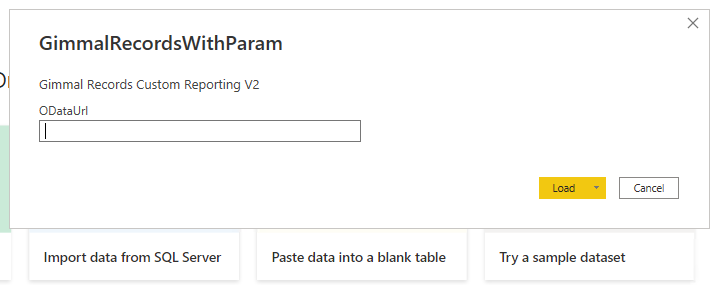
Enter the OData URL that is needed, which must include the /odata path at the end of the URL (for example, https://records.gimmal.cloud/odata). After entering the URL, click Load.
You should then be prompted with a new window to supply a set of credentials, like so:
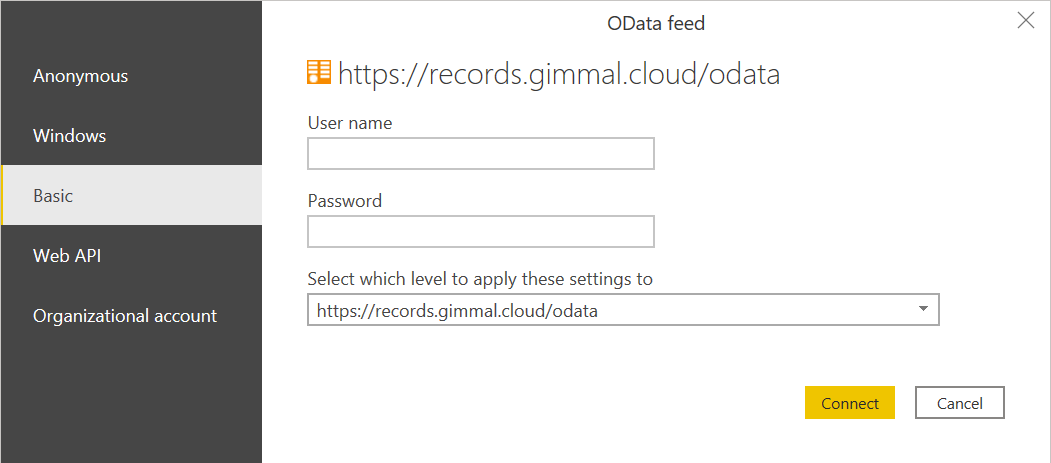
Enter the Service User credentials under the Basic tab (as shown above) and click Connect. The data should load shortly afterward.
Relationships
Relationships have been pre-created to show the proper relationships between tables.
Report Pages
The Power BI template provides four pages, each described in this section.
Dashboard
The Dashboard shows several high-level visuals focused on the current state of records in the system. This dashboard uses the following tables:
records
legalholds
Additional columns were created in Power Query to aid in creating visuals:
ExpiredDays | How many days have expired since retention has expired on a record, or blank if retention has not expired |
FileName | Parsed from PropertyBag, it contains the name of the file |
FileSize | Parsed from PropertyBag, it contains the size, in bytes, of the file |
Repository | Parsed from PropertyBag, it contains the repository a record exists in |
Measures were created to help show some quick visual of records in the system:
DeclaredRecords | Uses IsRecord to count the number of declared records in the system |
SumManagedFileSize | Uses FileSize and RecordClassTitle to sum the size of records that are classified to a Record Class |
SumUnmanagedFileSize | Uses FileSize and RecordClassTitle to sum the size of records that are not classified to a Record Class |
Records
The Records page displays a table of records meeting the criteria of the dropdowns in the header. By default, only manually classified records are displayed, however, you can also choose Obsolete, Superseded, Permanent, and Vital records.
This table could grow very large depending on the values selected. Be cautious of your selections.
Trigger Impact
The Trigger Impact page displays several tables. Moving from left to right, you can select elements of the File Plan and see which records are impacted. By default, the table will now show any records as that list could be extremely large.
An additional Measure was created (TriggerRetentionLifecycle) to prevent records from showing in the table until a File Plan element was selected.
File Plan Exceptions
The File Plan Exceptions page displays several lists showing potential exceptions in the File Plan.
Record Classes without Classification Rules
Record Classes without Lifecycles
Triggers without Retentions
Retentions without Lifecycles
Download
Here is the latest version of the Power BI Template:
Gimmal Records OData Power BI Template.pbit
If, for any reason, the previous template is needed, it can be downloaded here:
(OLD) GimmalRecords - Power BI Template (OLD).pbit
Addendum - Including Property Bag Items
There are several extended metadata properties for a Gimmal Records item that may be included in a container referred to as a ‘property bag’. This section of the document provides instructions on how to include values for these property bag items in a PowerBI extraction.
This is advanced functionality and Gimmal recommends that only users with experience in PowerBI attempt this procedure.
Converting the Property Bag
The Record.PropertyBag column is a well-formed JSON string. It is necessary to convert this column’s data type to a more usable Table in Power BI. Load the data in the Power Query Editor by using the Transform Data button in the Home tab of the ribbon bar.
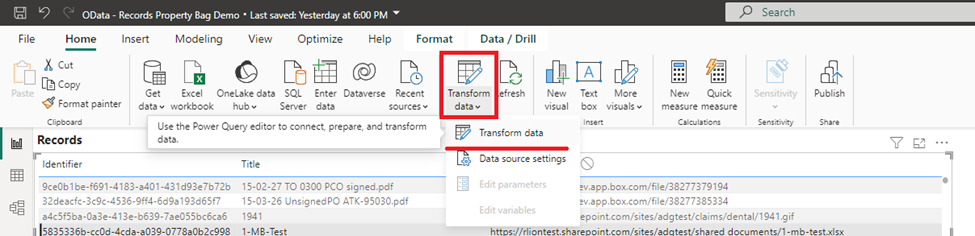
Transform data button in the Home tab ribbon
Next, right-click on the records query and choose Reference. This will create a new view of the records Table without modifying it. Name your new table whatever you would like. In this example, it is named recordsPropertyBag.
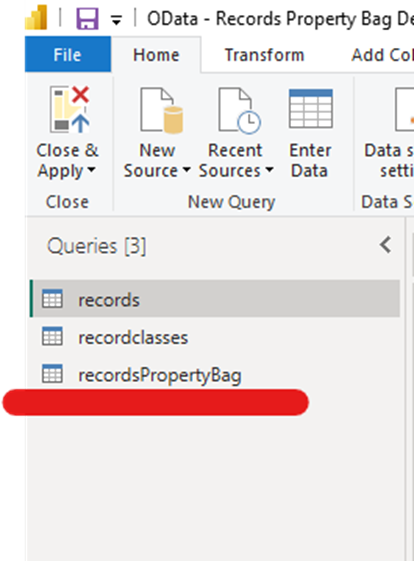
New table created
Select the recordPropertyBag item under the Queries section, then click Advanced Editor from the Home Tab. You will now see the Power Query code editor for this table. Copy and paste the following code and click Done.
let
Source = records,
#"Renamed Columns" = Table.RenameColumns(Source,{{"Id", "RecordId"}}),
#"Removed Other Columns" = Table.SelectColumns(#"Renamed Columns",{"RecordId", "RecordClassId", "PropertyBag"}),
#"Parsed JSON" = Table.TransformColumns(#"Removed Other Columns",{{"PropertyBag", Json.Document}}),
#"Expanded PropertyBag" = Table.ExpandListColumn(#"Parsed JSON", "PropertyBag"),
#"Expanded PropertyBag1" = Table.ExpandRecordColumn(#"Expanded PropertyBag", "PropertyBag", {"Key", "Value"}, {"PropertyBag.Key", "PropertyBag.Value"})
in
#"Expanded PropertyBag1"
Note line 5, the Table.TransformColumns function parses the Records’ PropertyBag column using the Json.Document function for each row in your data source. This ensures the well-formed JSON string is correctly parsed and represents the data accurately.
Exit the Power Query Editor by choosing Close and Apply from the Home tab in the ribbon bar. Power BI will now apply your new data model. This may take some time. Once it’s completed, you can choose Model View and configure the relationships as illustrated below.
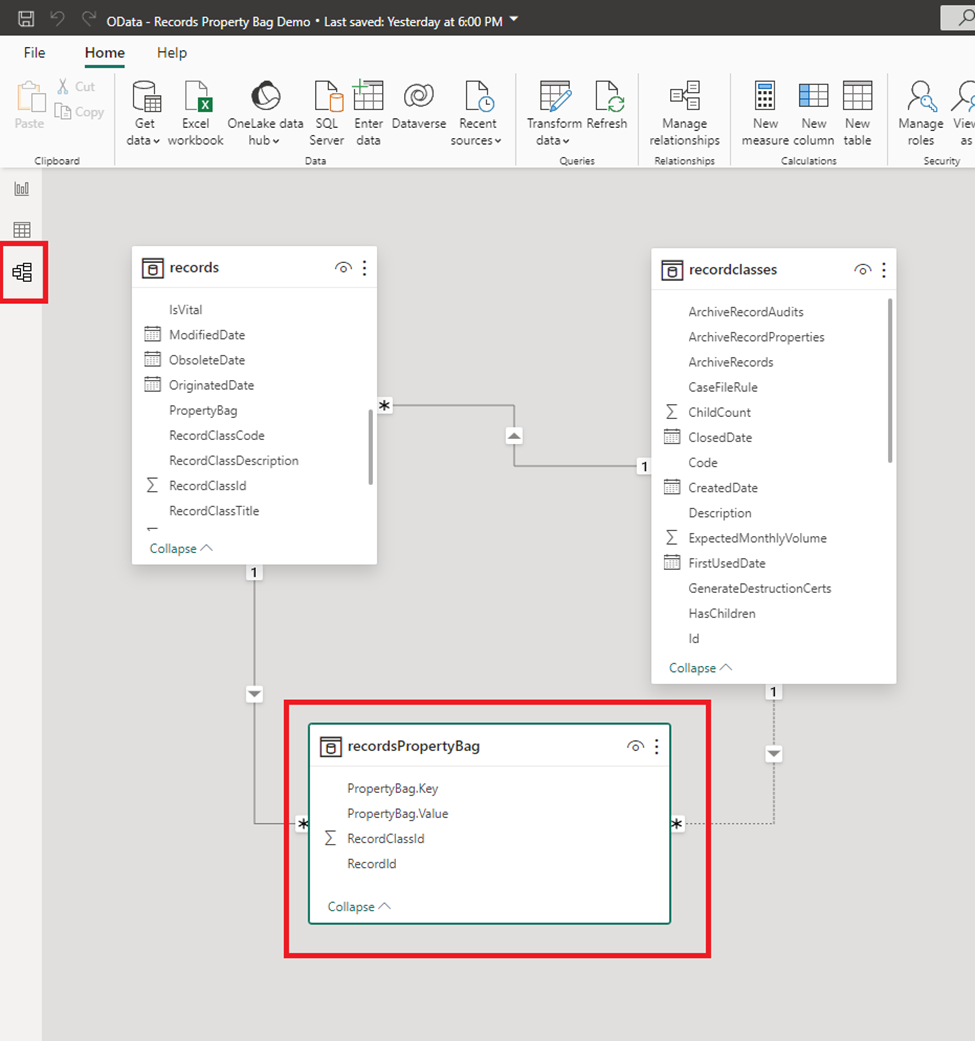
Model view of the data relationships
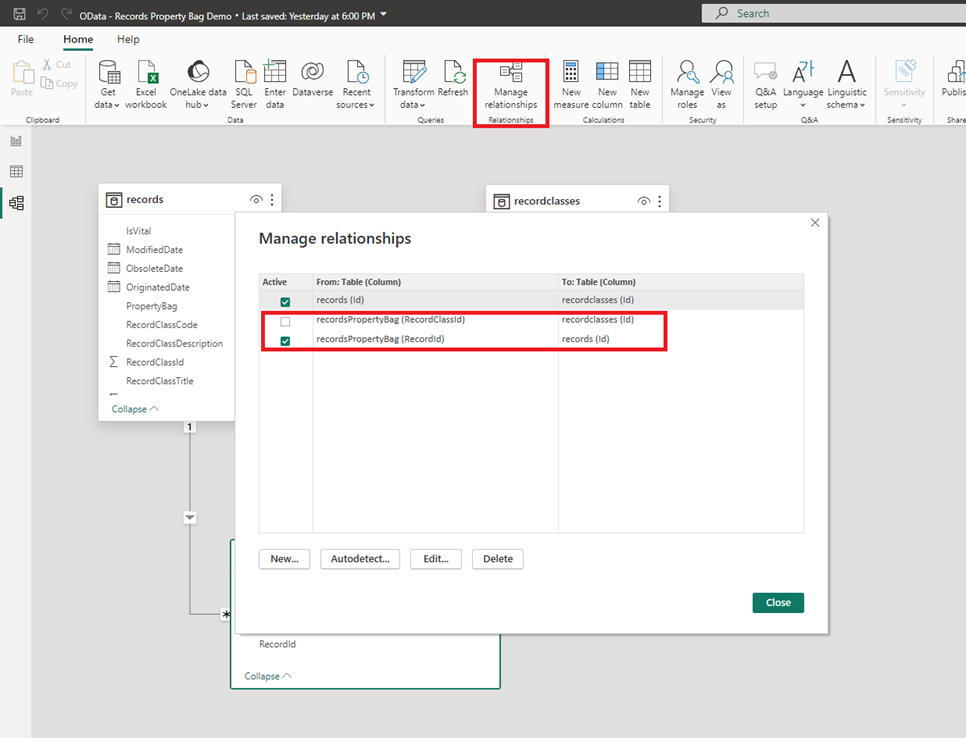
Configuring data relationship
This results in a table with one row per property and a single column for all of the property names, PropertyBag.Key, and a single column for all of the property values, PropertyBag.Value. The next step is to transform the data so that each row now represents a single record, with a column for each property.
Return to the Report view and in the Home tab of the ribbon, click Transform data. Make sure the recordsPropertyBag query is selected then complete these steps:
Select the PropertyBag.Key column
In the Transform tab of the ribbon, click Pivot Column - In the popup window that displays, you will see the message that you will "use names in column "PropertyBag.Key" to create new columns".
In the Values Column drop-down, select PropertyBag.Value, since this is where the values for the new columns are sourced from.
Expand Advanced options and select Don't Aggregate
Click OK
Close the Query Editor to return to the Report View, you will now see that the recordsPropertyBag table has a column for each property.