Content Server Discovery, Analytics and De-duplication Tool User and install Guide
1. Requirements
This section provides information about usage requirements for running the Gimmal Content Server Analytics and Deduplication Tool (formerly known as ECM Wise).
1.1 Compatibility
The Exporter Tool supports the following Content Server environments.
Server Versions Supported by 4.8:
Livelink 9.7.1 | Oracle backend | Certified and tested |
Livelink 9.7.1 | SQL Server backend | Certified and tested |
Content Server 10 | Oracle backend | Certified and tested |
Content Server 10 | SQL Server backend | Certified and tested |
Content Server 10.5 | Oracle backend | Certified and tested |
Content Server 10.5 | SQL Server backend | Certified and tested |
Content Server 16.X | Oracle backend | Certified and tested |
Content Server 16.X | SQL Server backend | Certified and tested |
Server Versions Supported by 4.9
Content Server 22.X and up | Oracle backend | Certified and tested |
Content Server 22.X and up | SQL Server backend | Certified and tested |
As noted, version 4.9 of the product only supports Content Server 22.x and up due to changes required to support the Content Server web services references, which had some changes w.r.t variable types
1.2 Client Software Pre-requisites
Pre-requisites for the Client/Host PC must be satisfied:
Requires .NET Framework 4.7.2 or 4.8 installed on the client (host) where the tool will be run.
If the source Livelink System database is using Oracle, the client you run off of must have appropriate Oracle Client installed with TNS listeners configured (as these settings are environment specific please consult your local IT stakeholders for assistance)
Appropriate OLE DB provider for the client operating system (32 or 64 bit) must be installed and registered correctly.
1.3 Database Account and Roles
This tool directly queries the Content Server database schema to conduct advanced queries and reporting. As such you must provide database credentials with the required minimum read access role to the entire Content Server schema. In addition the User ID specified must have default schema set to the Content Server schema.
Example database credentials
User ID: livelinkdb
Using SQL Server Management Studio or Oracle SQL Developer – you should be able to login using the database account specified for Tool use and successfully query the Content Server database with the following sql statement:
select count(*) from dtree;
If the above query does not return a successful result that means the account does not have the correct database schema access. Please ensure that the account provided has the correct access and configuration.
Please note: If your Content Server environment is using a SQL Server database, the account you provide will also require having mixed-mode authentication enabled via SQL Server Management Studio.
1.4 Database Connection Timeouts
Please be advised that the tool will perform long running queries in cases where large parent folder area is selected for analysis. For example in large environments some queries can and should take upwards of 5-10 hours to complete. This is dependent on your database configuration - performance and usage characteristics (load).
Oracle
For Oracle, the timeout period for queries is dependent on your database configuration.
Please ensure you review any timeout periods with your database administrator to ensure that long running queries will not be stopped.
SQL Server
For SQL Server, the timeout period is set by default to 10 hours.
This is configurable in the app.config file which can be found in your home install location. Look for the Connection Strings > Sql Server > Connection Timeout parameter.
2. Overview and Optimizations
2.1 About
This quick start user guide is intended to provide a quick reference for Users/Administrators.
This tool specifically performs read only queries against the Content Server database.
The Content Server database is not modified in any way, nor are object audit trails in Content Server affected by those read operations.
Gimmal - has created this tool as standalone reporting tool to allow an administrator the ability to generate advanced Livelink Content Server Analytics and De-duplication reports for determining redundant, obsolete and trivial content (ROT) and to assist with migration pre-planning (identify what exists in a migration folder area).
Use cases supported:
Migration Planning and Analysis
Before an organization undertakes a migration of content from Livelink Content Server to another document management system – it is important to understand what each parent migration area contains via intelligent content analysis
Allows deep dive and identification of old content, long paths, problem mime types or undefined mime types
Support cleanup efforts prior to undertaking migration effort
Content Analytics Supporting Information Governance
Continuous identification of ROT
Identify duplicated documents across the enterprise
Enable ability to capture items for actionable removal
The Content Server Discovery, Analytics and De-duplication Tool benefits:
Support providing a detailed analysis for your Livelink Content Server folder areas identifying:
Object, version and disk space statistics
Sub types and counts
Mime types and counts
Reserved items and counts
Metadata analysis and breakdown by application
Empty containers
Aging reports for documents
Not modified in the last X years
Not viewed in the last Y years
Full export of your folder hierarchy at a glance
Allow users to identify long paths
Full export of your folder access control lists (permissions)
Full export of duplicate documents
Identify and assist with elimination of redundant, outdated, and trivial content (ROT) from Content Server
Provide a systematic approach for identifying ROT
Enable Administrators to make decisions or take action based on identified ROT
Aging reports, and by empty containers
Support information management policies for content management
Object IDs and links
2.2 Overview of Use
The Content Server Discovery, Analytics and De-duplication Tool
Is intended to be run on a Client / Host PC
Requires database credentials to access the source Livelink Content Server database
Performs read only operations
Exports output to local or network shared drive with adequate capacity
Generates unique time stamp log folder w/ log file
Generates analytics reports depending on the options chosen
Analysis Report
ACLReport_NODEID (NODEID represents each parent folder that was selected for analysis)
HierarchyReport_NODEID (NODEID represents each parent folder that was selected for analysis)
Deduplication Report
Please note if the Content Server environment or database is down or unavailable during a run, errors will be reported and analysis will likely be interrupted or timed-out. This tool is not responsible for managing or preventing such outages.
Please note – analysis of parent folder areas which contain Project Workspaces will take longer for analysis. When selecting areas for analysis where you know Projects reside – please use care as additional processing time will be required.
2.3 Custom Enterprise Workspace ID
By default the Enterprise Workspace ID in Content Server is 2000. There are some cases where the Enterprise Workspace is configured differently and there may be use of an ID other than 2000 for the Enterprise Workspace subtype.
If your organization is using an ID other than 2000 for the Enterprise Workspace, you can change the default ID that the Content Server Analytics tool uses.
To change the default ID please change the “Start from Content Server Id” field from the Analytics Tab of the tool.
2.4 Performance Considerations and Tips
Speed and performance of the Tool is dependent on many factors.
Gimmal - does not warrant or guarantee the performance of the Content Server Analytics and De-duplication Tool in any way. We outline some tips and considerations for optimization of performance below. The implementation of optimization considerations and tips is out of scope for this tool and document.
The performance of the analysis depends on many factors such as:
Network latency
Database configuration and usage load
Size of the locations chosen for analysis
We have included a default 5 million object limit warning that is checked prior to analysis start. This limit can be disabled but areas analyzed with large number of objects will take a long time to complete. We have seen analysis take over 10 hours in some large folder areas, be aware that locations that contain project workspaces will also be slower, exercise general caution for choosing areas for analysis – follow best practice for choosing smaller subsets for analysis.
Other factors
Amount of metadata
Complexity of permission ACL entries (# of items in an ACL list)
Size and speed of destination location
Memory available on client/host machine (where you are running the Tool)
Performance Tip 1:
A technique would be to split the location analysis into smaller chunks and run on multiple clients to achieve parallel processing. In this case the limiting factor would be the database servers’ capability to handle the additional load.
Performance Tip 2:
Please ensure the client/host has adequate amount of RAM memory (minimum 8 GB).
3. Using the Content Server Discovery, Analytics and De-duplication Tool
3.1 Activation
Please note a valid activation code is required on first use of the Content Server Discovery, Analytics and De-duplication Tool, required for every Client PC that it is run on.
Upon purchase of the Tool you would have been provided details on how to obtain the necessary activation codes for your requisite Client PC use.
When first running the Tool you will be required to specify a unique license key to register the product for use. You can enter the provided License Key in the “About” tab and by clicking the “Register” button. The registration will occur one time and will activate the software for use, no further activation will be required.
If you require assistance or would like to obtain additional activation codes for additional Client PC use within your environment please contact your Gimmal support contact.
3.2 Connection Settings
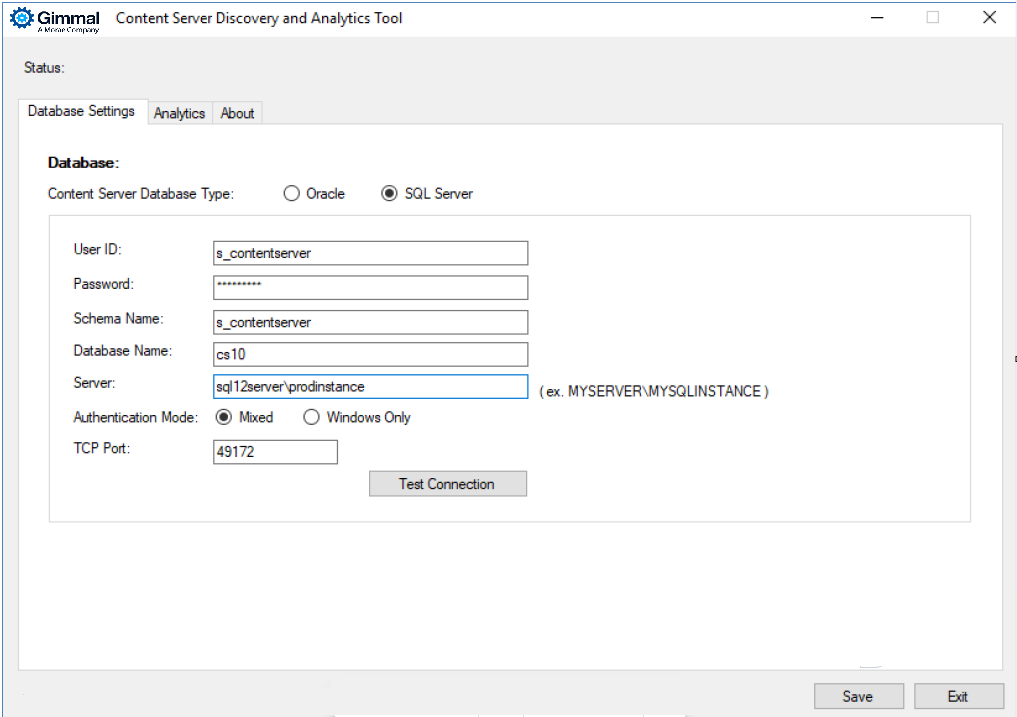
The user must provide the source Content Server database schema credentials as displayed in the screenshot below. Refer to section 1.3 of this document for additional notes on providing the correct credentials.
You must also specify your database type here – SQL Server or Oracle, as well as database name. If your schema is set by default to the Content Server schema you do not need to provide the Schema Name, if you are unsure please provide the schema name for the database just in case.
If you specify SQL Server you must include the Server Address, note that this is not required for Oracle as it uses the TNS names.
Please click “Test Connection” to verify that you have specified valid credentials to communicate with SQL Server or Oracle.
3.3 Analytics and De-duplication
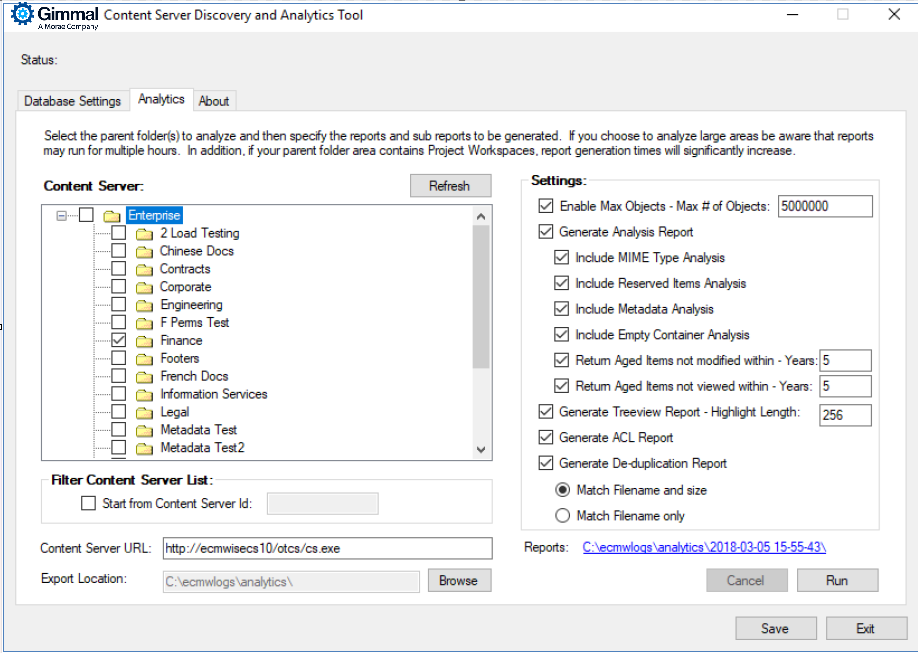
Step 1: Select the Content Server parent nodes for analysis
Carefully select the parent folder areas for your analysis and click the “Add Location” button.
Please avoid selecting huge folder areas or selecting the entire Enterprise folder structure as this can lead to long run times for analysis.
Best practice is to choose the specific areas you are looking to migrate or optimize for your analysis. You can also remove folders from analysis by clicking the “Remove Location” button.
Step 2: Check and enable the safety / performance setting - max # objects for analysis
To prevent long running reports the max # of object setting will check the folder areas for the maximum total number of objects and will prevent running if that number is exceeded.
The default recommended maximum value set is 5,000,000 objects. You can increase or decrease the value as you see fit. Likewise you can also disable this safety / performance check if you intend to run the reports on large areas exceeding 5,000,000 objects.
Please use care when exceeding the recommended default setting as this will lead to long running reports.
Step 3: Choose the report types and options you wish to generate
Each of the reports below will be generated as separate report files – the Analysis and De-duplication reports are single files for all the areas selected for analysis.
Each of the Treeview (Hierarchy) and ACL reports will be individual separated report files for each parent folder area selected, the report name will be appended with the node id of the parent folder.
Report Types Summary
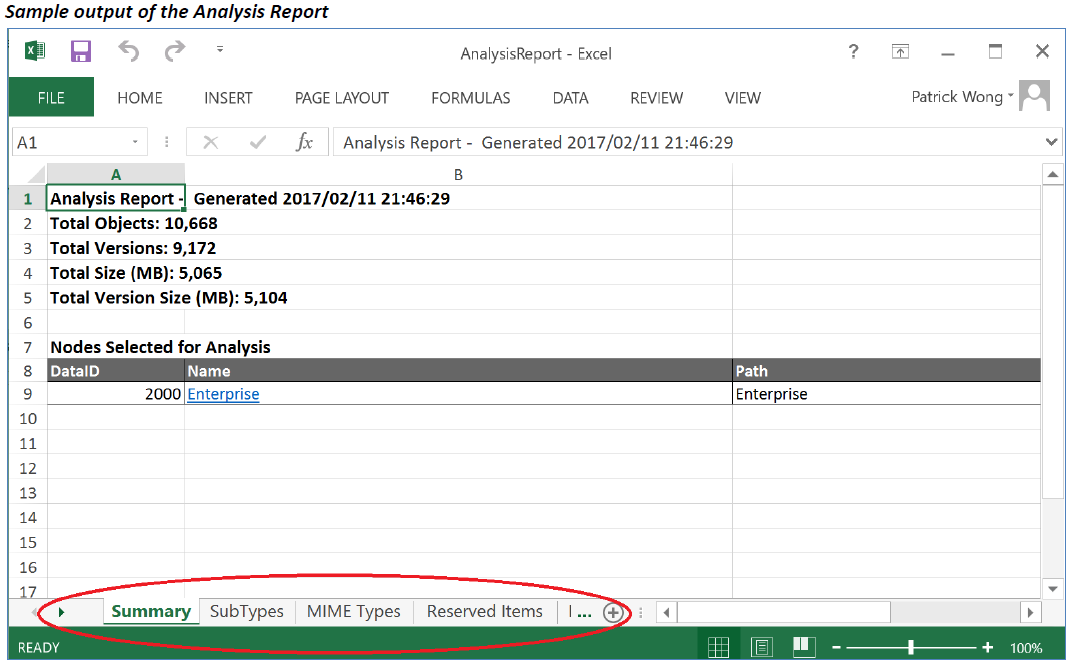
Generate Analysis Report
Default sizing report
Helpful for determining overall size in the analysis area including number of versions to be considered
Report includes total objects, versions, size (MB) and version size (MB)
Default subtype report
Helpful for analysis of Content Server subtype use and prevalence
Report includes subtype #, description, count, version count, total size (MB), total version size (MB)
Optional mimetype report
Helpful for understanding file mime types included in the analysis area chosen
Including mimetype, count, version count, total size (MB), total version size (MB)
Optional reserved items report
Determines and lists the “checked-out / reserved” documents in the chosen analysis area
Allows administrator to identify the business users to contact for un-reserving the documents
Report includes data ids, names, reserved by user, reserved date
Optional metadata report
Determines and lists the metadata applied to either documents or containers in the chosen analysis area
Report includes data ids, category names, document count, and container count
Optional empty container report
Determines and lists the empty containers in the chosen analysis area – useful for determining redundant, obsolete or trivial containers
Report includes data ids, names, and paths o Optional aging report for items that haven’t been modified in X years
Determines and lists documents that haven’t been modified in X years – useful for determining redundant, obsolete or trivial content
Report includes data ids, names, and the corresponding last modified date
Optional aging report for items that haven’t been viewed in X years
Determines and lists documents that haven’t been viewed in X years – useful for determining redundant, obsolete or trivial content
Report includes data ids, names, and the corresponding last viewed date
Generate Treeview Report
Generate a report file for each selected parent node selected for analysis - If the limit on the rows in an Excel worksheet is exceeded (approx. 1 million rows) new subsequent worksheet(s) will be generated
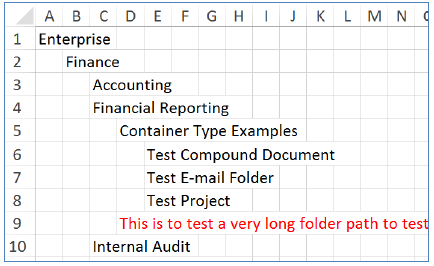
You can set the highlight length – default value is 256 characters. If the path exceeds the highlight length limit the folder path will be highlighted in red when the text length limit is exceeded.
This report is helpful for performing analysis of a folder hierarchy visually and to easily identify long folder paths
Each depth folder is displayed in a new column in the CSV file
Sample is shown below
Generate ACL Report
Generate a report file for each selected parent node selected for analysis - If the limit on the rows in an Excel worksheet is exceeded (approx. 1 million rows) new subsequent worksheet(s) will be generated
This report is helpful for generating a detailed permission listing for a folder hierarchy
Displays and lists the data ids, path, user/group name, and permissions
Generate De-duplication Report
Generates a single summary report file for the chosen analysis area - If the limit on the rows in an Excel worksheet is exceeded (approx. 1 million rows) new subsequent worksheet(s) will be generated
This report is helpful for generating / determining duplicate documents in the chosen analysis area
The user can choose to generate the report using Match Filename and size, or just Match Filename only
Displays and lists the data ids (clickable to obtain document), names, filenames, and file size (bytes)
Each set of matched duplicate items is highlighted with grouped by row color - for example below data id’s – 586948, 586272, 595868, and 591400 are all identified as a duplicate set based on file name and size. They are grouped by highlighted white background color.

3.3.2 Running Reports
To run the reports just user just needs to click the “run” button. The reports will be running, at any time the log file in the output folder can be reviewed to see that status for the reports for long running operations. A user can also choose to cancel long running reports by clicking the “cancel” button.
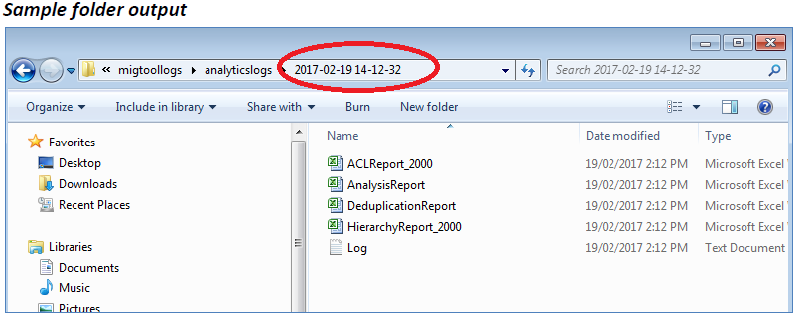
The output folder is a unique timestamped folder representing the time the reports were requested to be run. Please note that the folder contents include a log file summarizing the reports that were generated and the time taken for each report.
